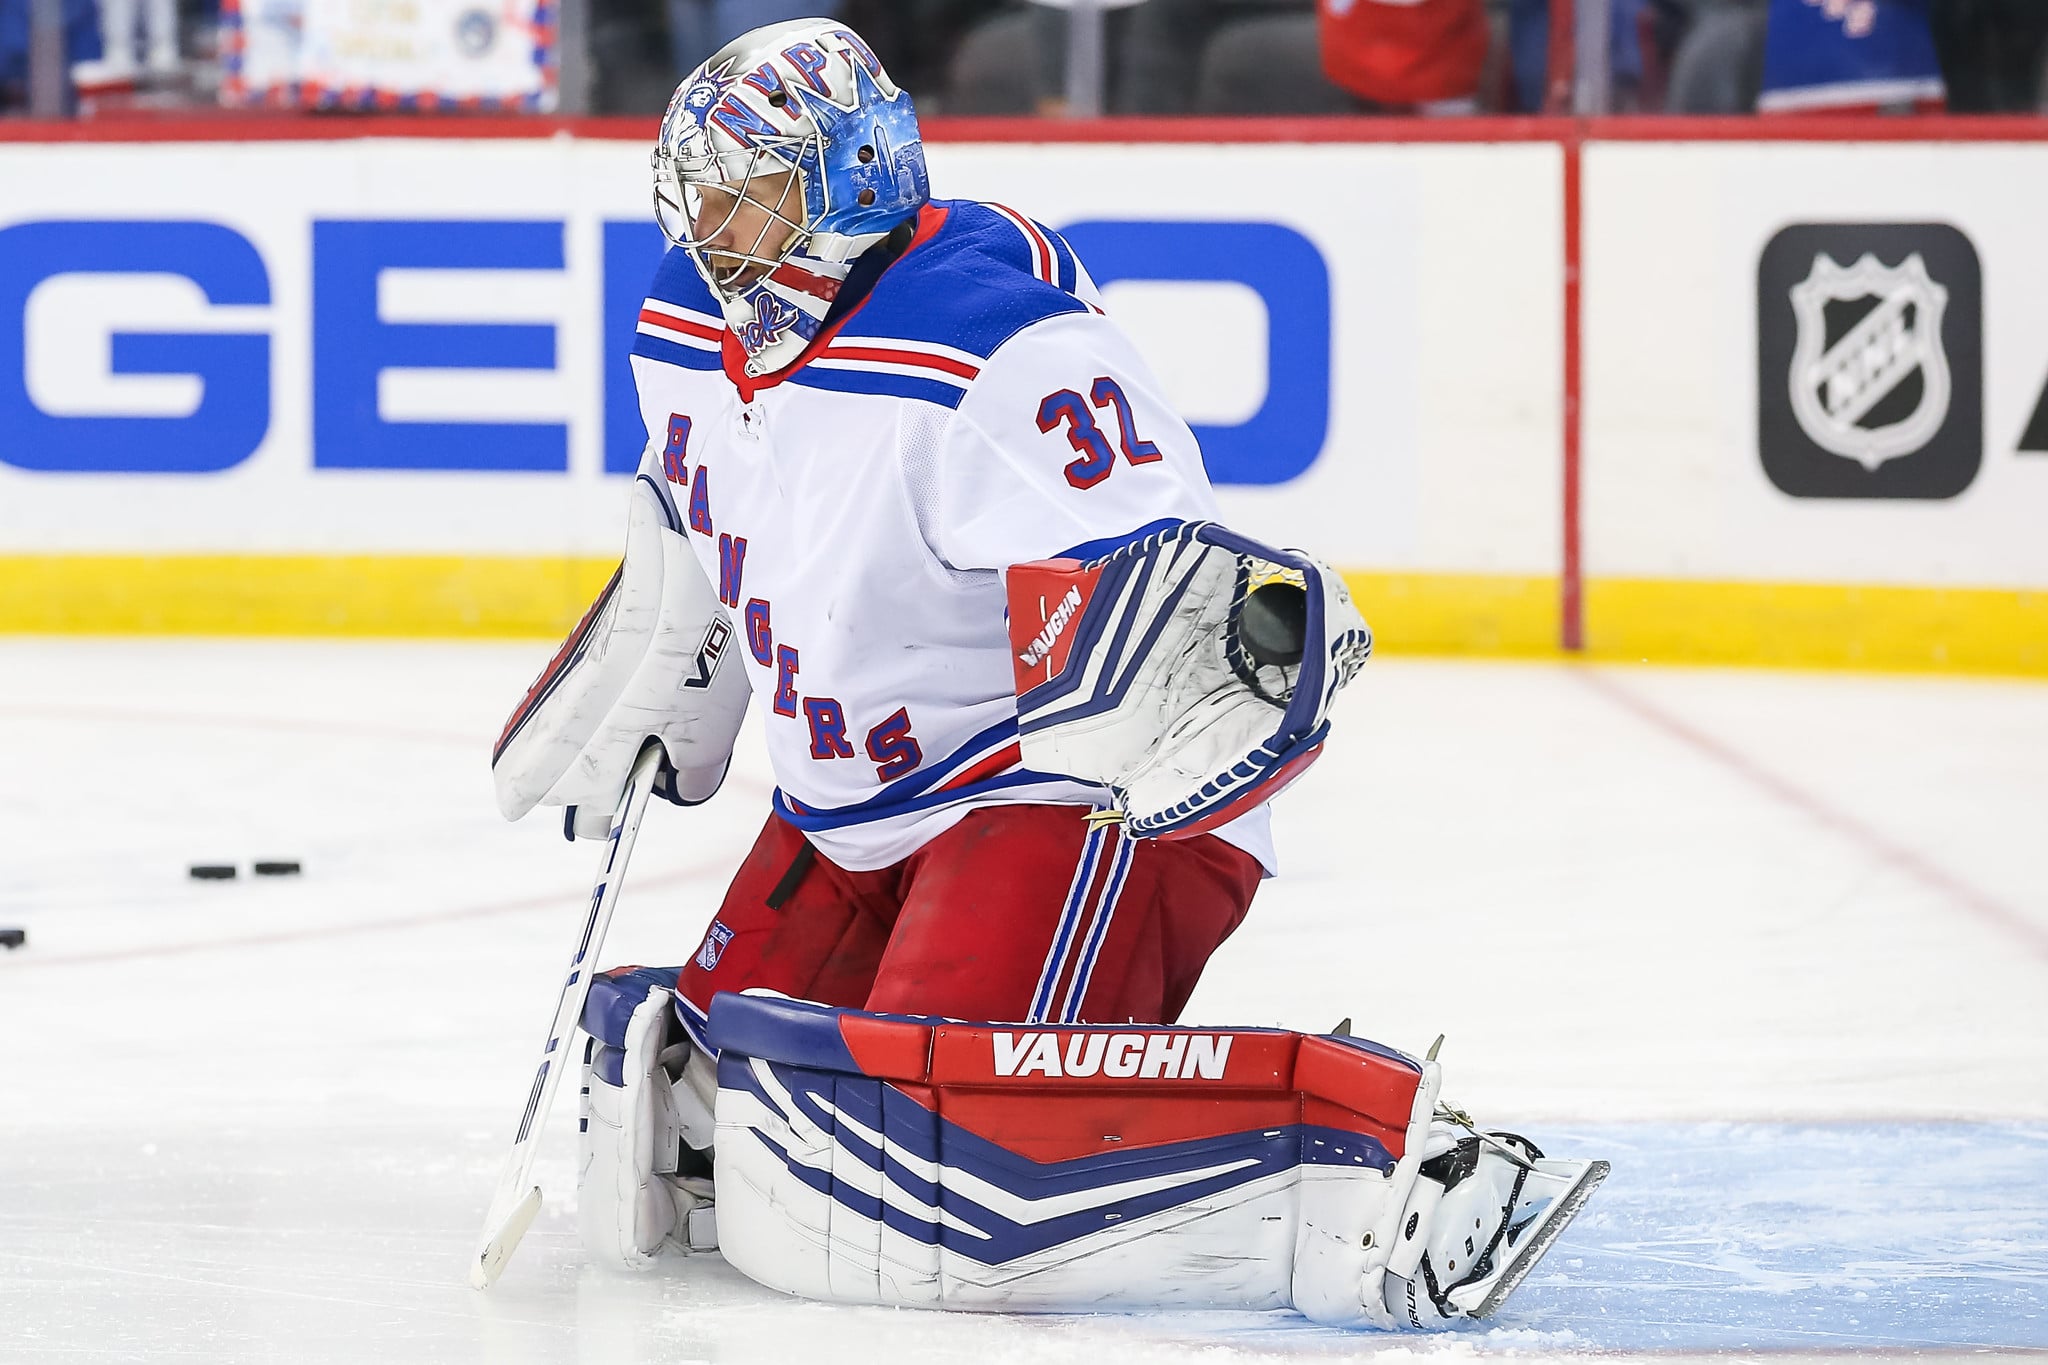
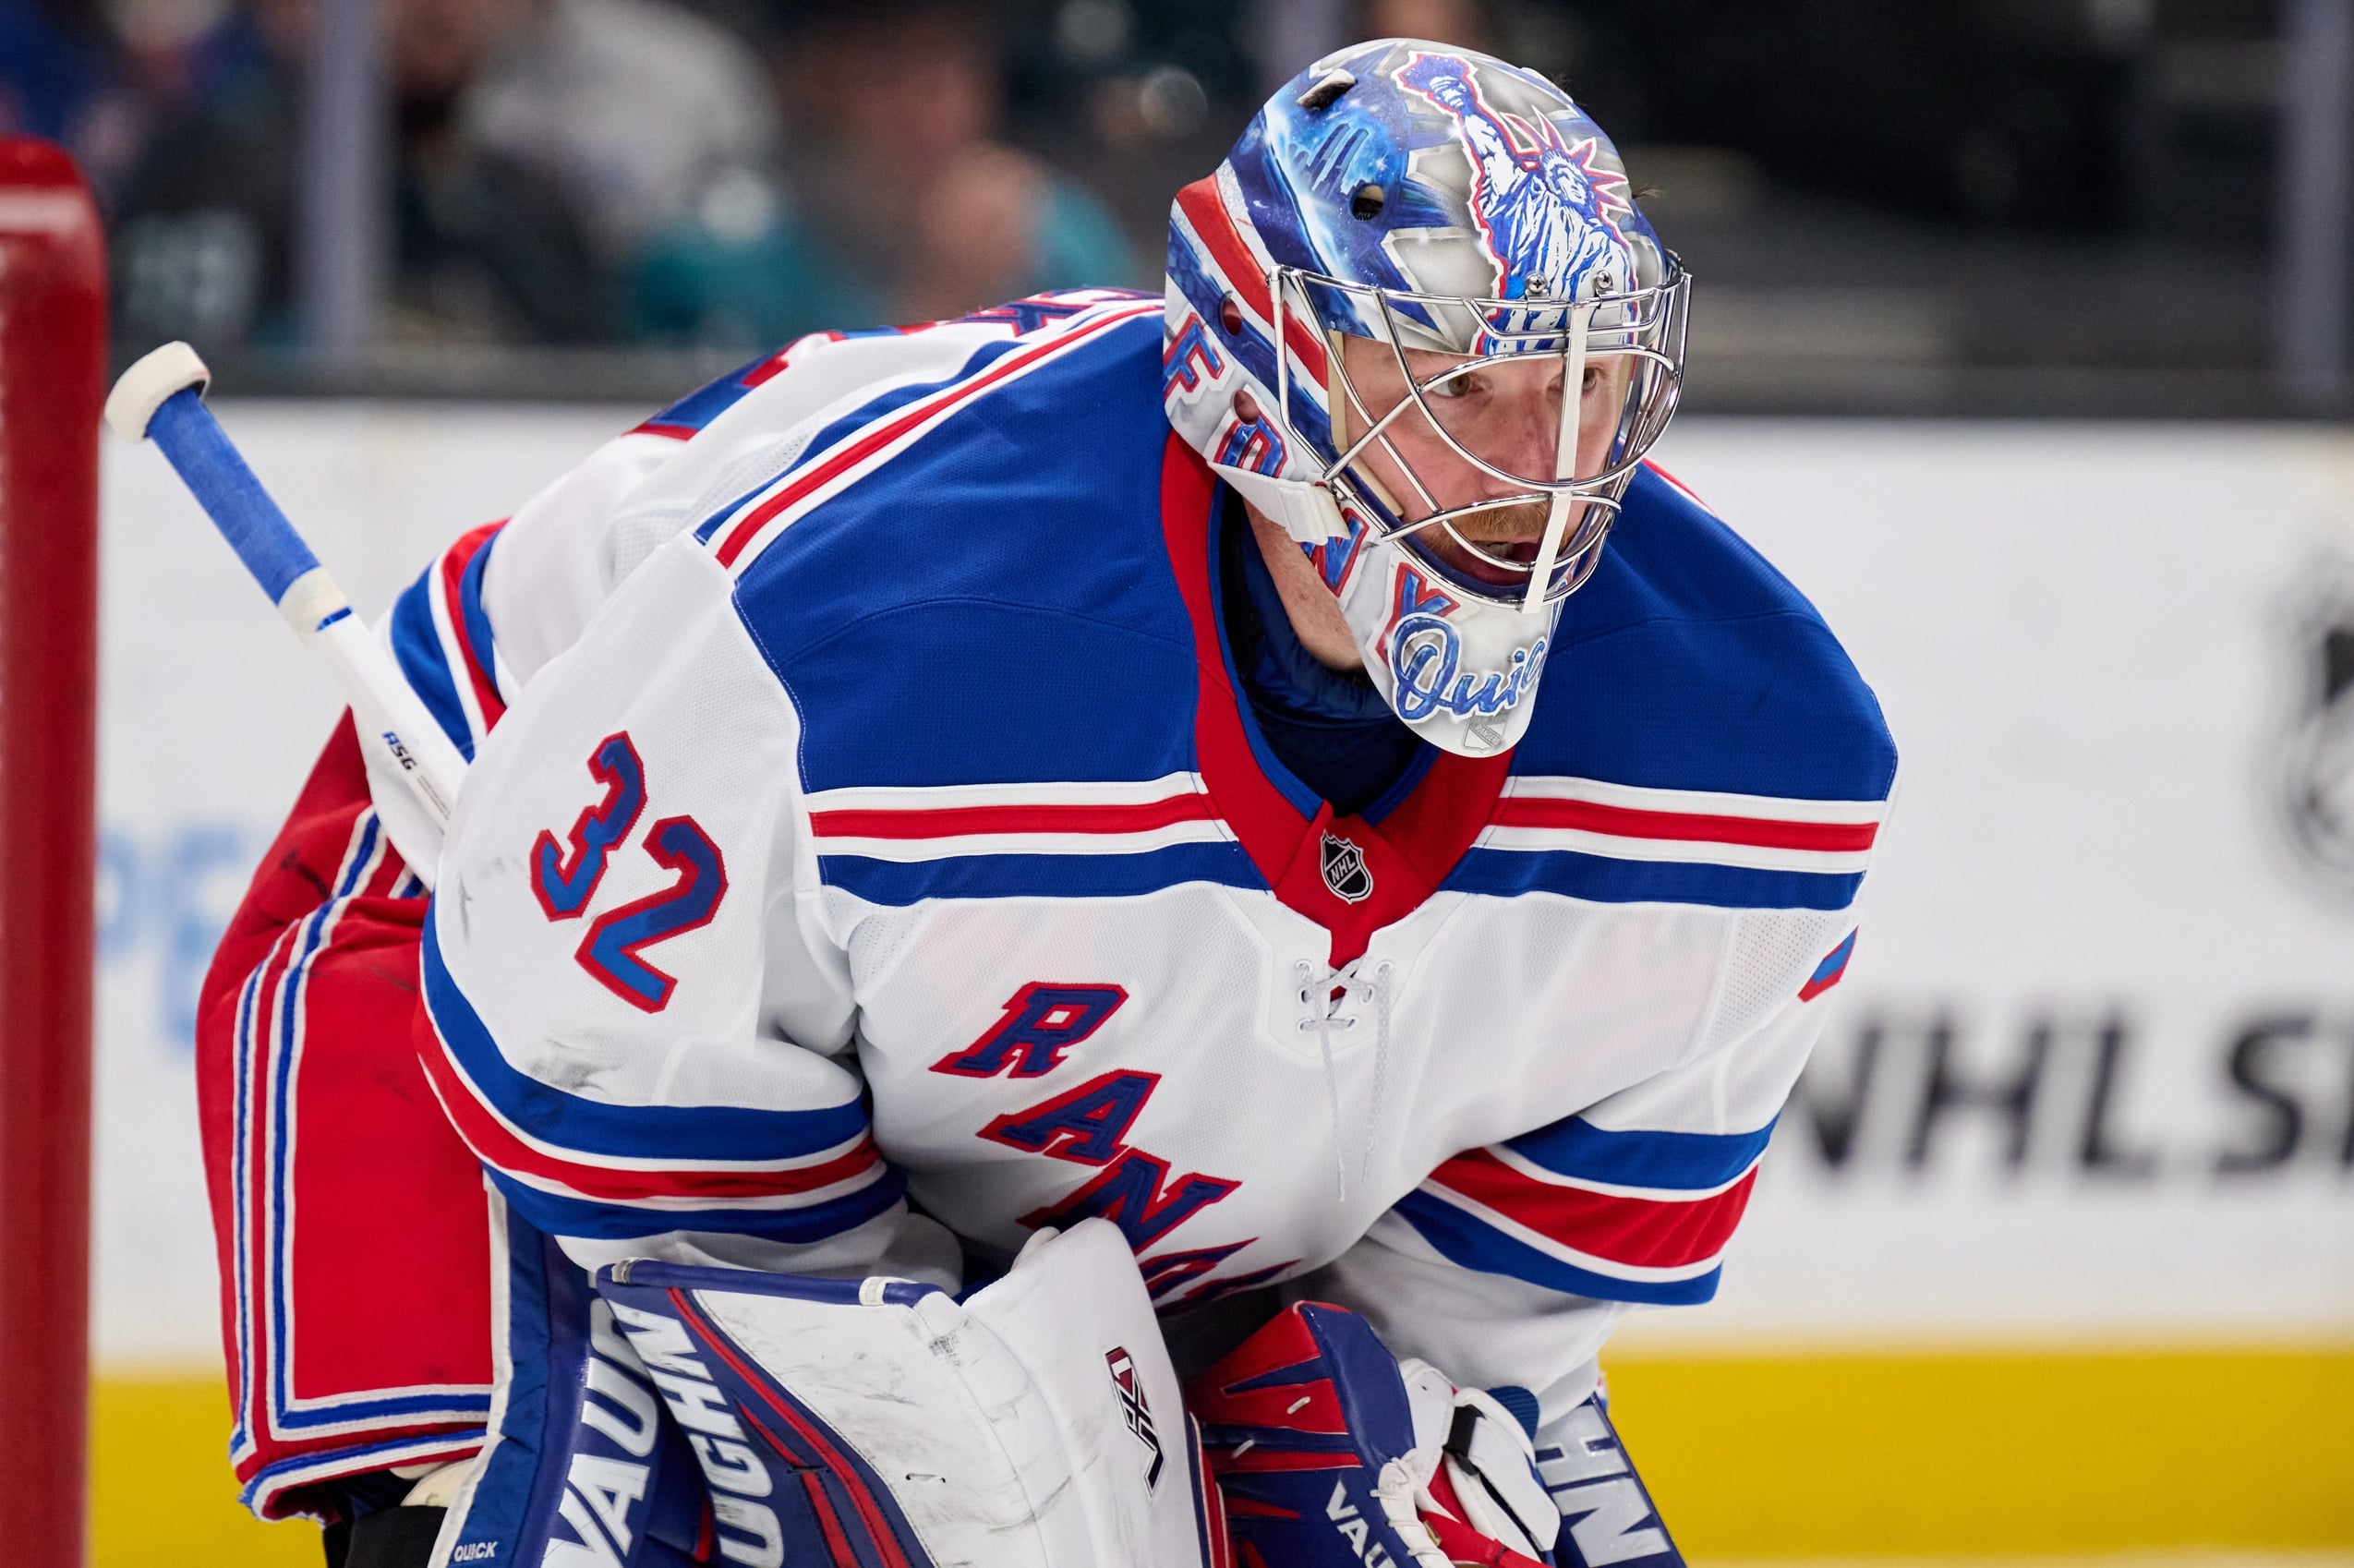
The New York Rangers have officially completed their regular season, finishing second in the Metropolitan Division. Their 52-24-6 record was good for 110 points, and their 52 wins tied for the second-most wins in franchise history (tied with the 1993-94 team). It takes a village to achieve those marks, but if you ask anyone who the main contributor was, the answer would unanimously be: Igor Shesterkin.
Shesterkin finished at or near the league’s top in every statistical category for goaltenders. He single-handedly allowed the Rangers a chance to stay in the playoff race before finding their game and coming into their own in the second half. His statistics were impressive, but they don’t finish at the top of the all-time marks for goaltending, so why would this be considered one of the greatest seasons ever?
First, let’s look at his stats with a comparison to the NHL record and the Rangers’ franchise record:
| Category (min. 45 GP) | Igor Shesterkin (2021-22) | Rangers’ Franchise Record | NHL Record |
| Wins | 36 | M. Richter – 42 (1993-94) | B. Holtby – 48 (2015-16) |
| Goals-Against Average | 2.07 | D. Kerr – 1.54 (1939-40) | D. Kerr – 1.54 (1939-40) |
| Save Percentage | .935 | I. Shesterkin – .935 | T. Thomas – .938 (2010-11) |
| Shutouts | 6 | H. Lundqvist – 11 (2010-11) | T. Esposito – 15 (1969-70) |
I’d be remiss to mention Jacques Plant and his .940 and .944 save percentages, but he didn’t play more than 40 games in either of those seasons. Another all-time great is Terry Sawchuck, who in 1951-52 posted a spectacular 1.90 goals-against average (GAA) in 70 games played. As great as Shesterkin’s numbers are, they don’t come close to some of the all-time marks. However, when you look at what is relative to the season those marks were set in, that’s when the picture is painted clearer.
League Averages and Shesterkin’s Dominance
When Dave Kerr and Terry Sawchuck set their brilliant marks, the league average for each team’s goals-per-game was 2.49 and 2.60, respectively. And when Tim Thomas finished the 2010-11 season when a .938, the league’s average was a .913.
In 1939-40, when Kerr had a 1.54 GAA, there were only seven teams, each playing 48 games. In 1951-52, when Sawchuck had a 1.90 GAA, there were only six teams, each playing 70 games. Back when Plant had a .944 save percentage (SV%), in 1970-71, there were 14 teams, each playing 78 games.
I am not taking anything away from what these gentlemen did, but it is noticeably more challenging to produce upper-echelon numbers now. In 1951-52, four out of the five goaltenders who played 70 games finished with a 2.47 GAA or better. In 1939-40, three goalies finished with below a 2.00 GAA.
Fast forward to the 2021-22 NHL season, and there are 32 teams, each playing 82 games. There is more travel, skill, and chaos during the regular season than ever before. Yet, in the midst of all that, Shesterkin managed a 2.07 GAA, .935 SV%, and six shutouts (SO). During this season, the league average for team goals per game was 3.14 (the highest mark since 3.24 in 1993-94).
Amongst the goaltenders that played this season, the average GAA was 2.92 (highest since 1995-96), and SV% was .907 (lowest since 2006-07). Scoring was up drastically, yet Shesterkin’s numbers defied the trends throughout the league. His .935 SV% this season ranks seventh all-time, a miraculous accomplishment for a goaltender who became an everyday number one just this season.
Shesterkin Compared to Hart and Vezina Winners
Only seven goaltenders in NHL history have won the Hart Trophy. Only four men have won the Hart and Vezina Trophies in the same season. With the Vezina handed out to the best goaltender, it takes a brilliant season (and some luck) for a goaltender to hear their name as the Hart recipient. Let’s look at those goaltenders’ numbers compared to Shesterkin’s and the league average.
| Name and Season | Numbers | League Averages | Trophies Won |
| Roy Worters: 1928-29 | 16-12-10, 1.15 GAA, 13 SO | 1.46 G/GP by team 1.39 GAA | Hart |
| Chuck Rayner: 1949-50 | 28-30-11, 2.62 GAA, 6 SO | 2.73 G/GP by team 2.73 GAA | Hart |
| Al Rollins: 1953-54 | 12-47-7, 3.21 GAA, 5 SO | 2.40 G/GP by team 2.37 GAA | Hart |
| Jacques Plant: 1961-62 | 42-14-14, 2.37 GAA, .923 SV%, 4 SO | 3.01 G/GP by team 2.98 GAA | Hart, Vezina |
| Dominik Hasek: 1996-97 | 37-20-10, 2.27 GAA, .930 SV%, 5 SO | 2.92 G/GP by team 2.80 GAA | Hart, Vezina |
| Dominik Hasek: 1997-98 | 33-23-13, 2.09 GAA, .932 SV%, 13 SO | 2.64 G/GP by team 2.53 GAA | Hart, Vezina |
| Jose Theodore: 2001-02 | 30-24-10, 2.11 GAA, .931 SV%, 7 SO | 2.62 G/GP by team 2.51 GAA | Hart, Vezina |
| Carey Price: 2014-15 | 44-16-6, 1.96 GAA, .933 SV%, 9 SO | 2.73 G/GP by team 2.52 GAA | Hart, Vezina |
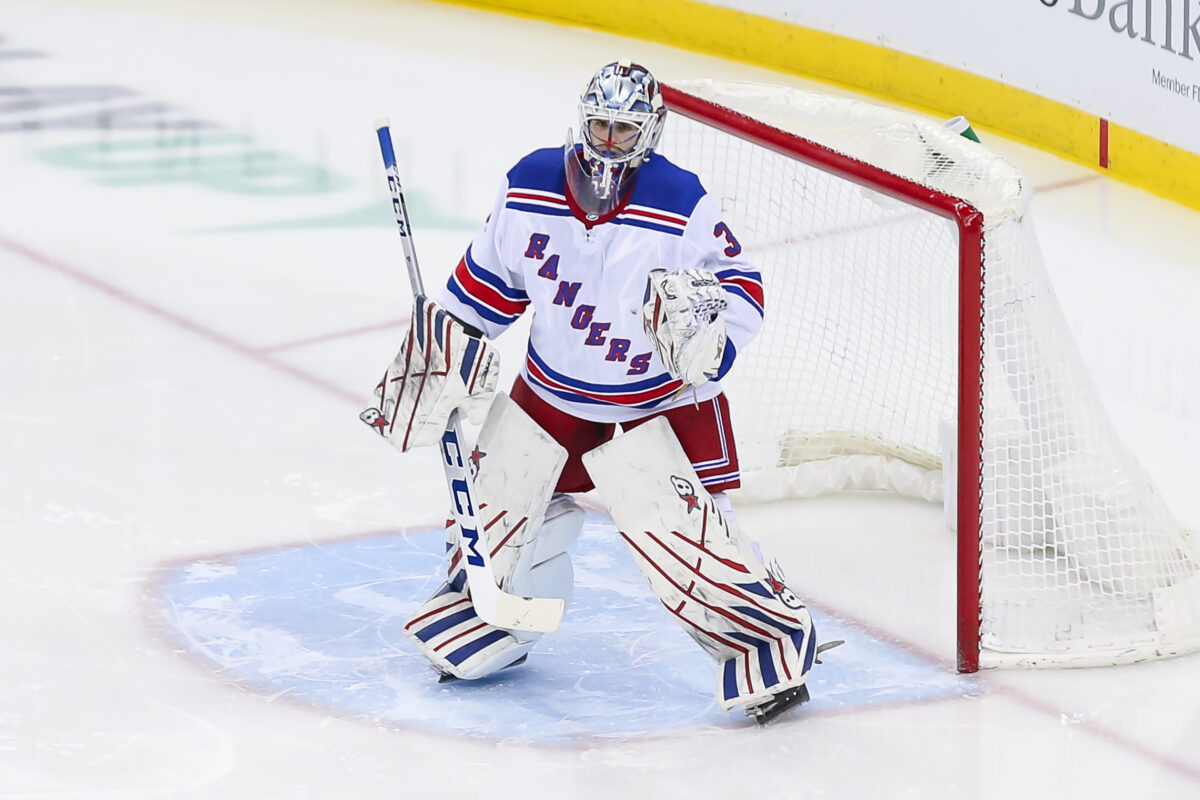
| Igor Shesterkin: 2021-22 | 36-13-4, 2.07 GAA, .935 SV%, 6 SO | 3.14 G/GP by team 2.92 GAA | ? |
Shesterkin’s numbers look eerily similar to former Vezina and Hart Trophy winners. Shesterkin’s numbers might be even more impressive when you add league averages into the mix, pushing his numbers ahead of those posted by these all-time greats.
So many times, we have seen offense take center stage during the awards process. This season, what Shesterkin did is easily enough for the Vezina but should also give him the Hart. It has been talked about how good he has been ‘this season,’ but we should be discussing how he just completed one of the greatest goaltending campaigns of all time.
His analytics only further the point, but I chose to leave those out of the equation due to the lack of analytics with some of the old-time numbers. When comparing his numbers to his peers this season and those who came before him, Shesterkin is my pick for the Vezina and Hart, and his greatness this year solidifies his case as one of the best goaltending seasons of all time.
Free Newsletter
Get Rangers Goaltending coverage delivered to your inbox
In-depth analysis, breaking news, and insider takes - free.
Subscribe Free →