Much has been made of the Detroit Red Wings’ expected goals metrics lately. I suppose that is to be expected, though.
As a quick refresher, a team’s expected goals total is derived by weighting all unblocked shot attempts by their probability of being a goal. That probability is determined by shot speed, location, type, and other variables depending on who is calculating the metric (i.e. Natural Stat Trick, Money Puck, etc.). The values for each unblocked shot attempt are added up to produce the team’s expected goal total.
As of now, Detroit sits 23rd in the NHL for five-on-five expected goals-against (xGA) per 60 (2.68) and their xGF%—ratio of expected goals-for (xGF) to xGA—ranks 29th. These numbers are not what you’d expect from a team currently in possession of a playoff spot.
“The main thing holding the Red Wings back is that they’re simply not controlling play to the level you’d expect from a playoff team,” said The Athletic’s Dom Luszczyszyn. (from ‘NHL Eastern Conference playoff race: Tiers and probabilities for the contenders and the long shots’ – The Athletic – 2/5/24)
“That’s true even during their spicy January, when the team had the third-worst expected goals percentage in the league. The results are what matter, but the underlying process suggests a market correction.”
Related: Red Wings vs. Expectations: Who’s Exceeding & Who’s Failing
Are Detroit’s expected goals metrics a problem, though? I don’t think so. Here’s why.
Red Wings vs. Expected Goals
To illustrate how expected goals may not accurately reflect Detroit’s performance, I put together a chart that shows unblocked shot attempt volume and the average danger—or average xGA value—of each unblocked shot attempt:
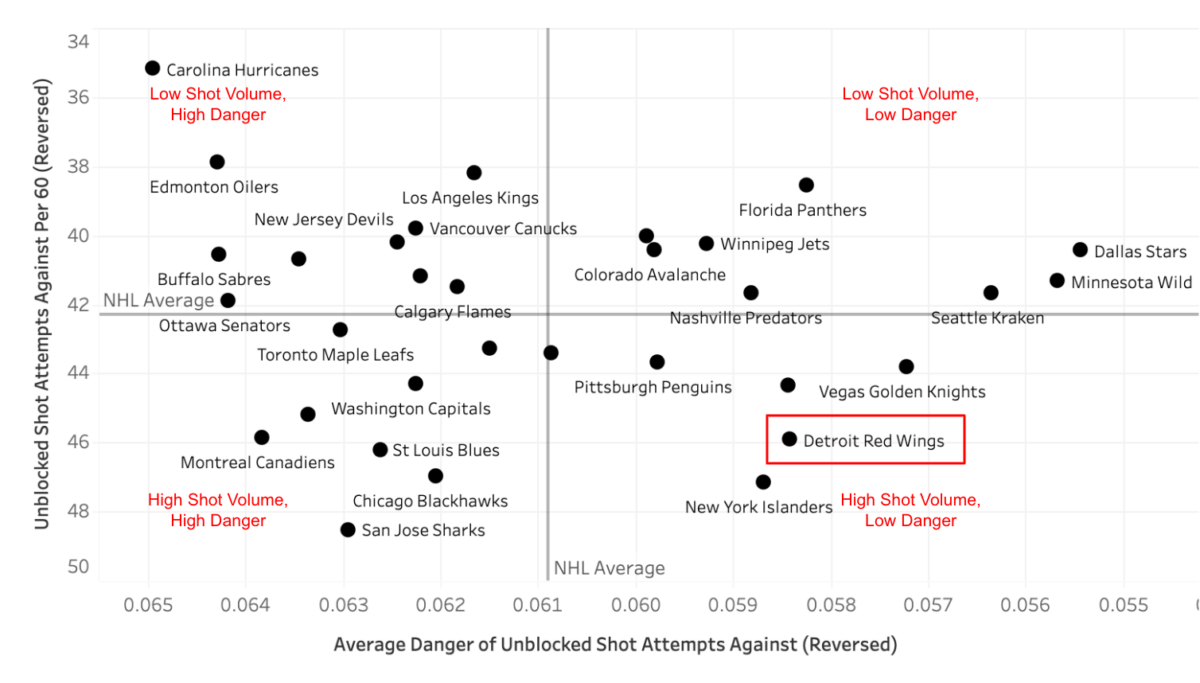
First and foremost, the Red Wings are giving up a lot of unblocked shot attempts. Their per 60 rate, 45.9, ranks 28th in the NHL.
What should be noted, though, is that if you’re giving up a lot of unblocked shot attempts, your xGA will naturally inflate. Each unblocked shot attempt has an xGA value, and all of those added up equals a high xGA number.
But if you look at the average danger of each unblocked shot attempt, the Red Wings are actually doing quite well. Their 0.584 xGA per unblocked shot attempt is fifth-best in the league, meaning Detroit does a great job of limiting opponents to lesser-danger shot attempts. The fact that they give up a lot of these kinds of shots isn’t a big issue.
In my opinion, high-danger chances at five on five are a better indicator of team success – for the Red Wings, at least. In Detroit’s first 50 games, the team that had a higher high-danger chances-for percentage (HDCF%) won 64 percent of the time. Further, when Red Wings won 71 percent of the contests when they had the higher HDCF% than their opponent. Both of these metrics had stronger correlation to wins than xGF%.
Red Wings’ Stats Moving Forward
Statistics are not perfect. Getting it right most of the time and more so than with other metrics is the best we can do. With that in mind, Detroit’s HDCF% is what should be monitored on a game-by-game basis moving forward.
Related: Red Wings’ Trade Deadline Needs Hinge On One Question
Stats like xGF% or xGA have their place. But assuming bad xGA numbers equals a bad team isn’t a great use case for the metric. If anything, the Red Wings should continue to monitor stats like xGA to keep an eye on how the expected goals are accumulating. If they’re from high-danger shot attempts, that’s not good. But if it’s from a lot of lesser-danger unblocked shot attempts, like what we’re seeing now, then that’s fine.
Data courtesy of Natural Stat Trick.
Free Newsletter
Get Advanced Stats coverage delivered to your inbox
In-depth analysis, breaking news, and insider takes - free.
Subscribe Free →