I recently wrote an article that proposed a new way to predict team success by using goal differential. I introduced a formula called the Pythagorean Expectation (PE) that produced an expected winning percentage (xWP) by looking at a team’s goal differential. With that percentage, I compared it with a team’s actual winning percentage (aWP) to determine which teams over and under-performed according to their expectations.
The idea behind researching PE was to calculate how many goals are needed to produce a win. By adding a team’s goal total, I can increase that team’s xWP until it equals one additional win. When a team’s xWP increases by 1.2 percent, the equivalent of one game in a full season, it is the same as winning one additional game. The number of goals added to increase xWP by 1.2 percent is that team’s Win Value (wV). Now, because teams have different goal totals, each team will have a different wV.
Applying the Theory
Using the 2016-17 Boston Bruins as an example, I started by using the original formula from my previous article. Here it is with Boston’s Goals For (GF) of 234 and Goals Against (GA) of 212 with the exponent of 2.19 that reflects scoring rates from last season:
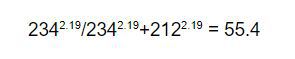
That formula produced an answer of 55.4, the Bruins’ expected winning percentage (xWP). Because my goal is to increase xWP to reflect one additional win, I needed to reach an xWP of 56.6 (as one game is equal to 1.2 percent). The number of goals needed to produce an xWP of 56.6 will be Boston’s wV.
To find Boston’s wV, I needed to add goals to increase their xWP to 56.6. I started by adding five goals to their GF total because hockey is a relatively low scoring sport, so I figured that a team’s wV will reflect that. I also chose five because it’s a nice well-rounded number to work with. Here is the formula with the added goals, keeping in mind that the team’s GA remains the same.
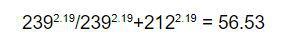
The new xWP of 56.53 was very close to 56.6 and I was fairly certain that five was the optimal value. However, I wanted to add another half goal, a total addition of 5.5, to get as close to 56.6 as possible. Here’s what using 5.5 looked like:
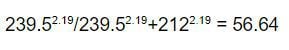
Because this was over my target xWP, I went with ‘The Price is Right’ rule and tried to stay below the target as much as possible. Therefore, for the 2016-17 Bruins, the optimal goal increase was five goals. To check that my calculations were accurate, I multiplied the new xWP of 56.53 by 82 games to get a win total:
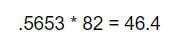
With their original goal differential, the Bruins had an expected win total of 45.4 so adding the five goals to get an answer of 46.4 wins gives an exact increase of one win. This means that the 2016-17 Bruins had a wV of five goals. Had Brad Marchand, David Pastrnak, Patrice Bergeron, David Krejci and Torey Krug scored one more goal each with Boston’s goaltenders not allowing any additional goals, the Bruins would have had one additional win.
2016-17 Season
Findings
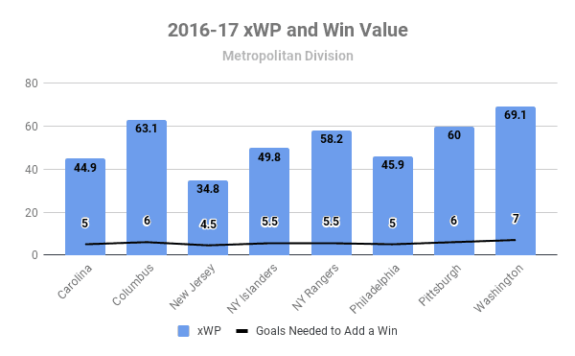
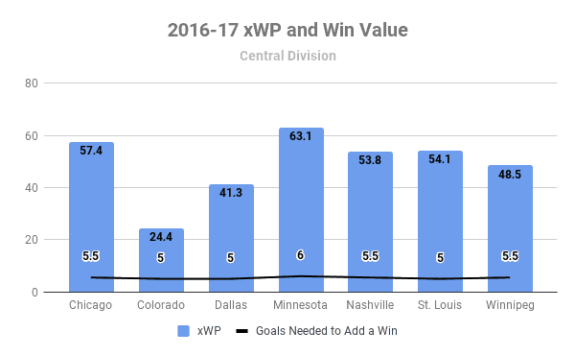
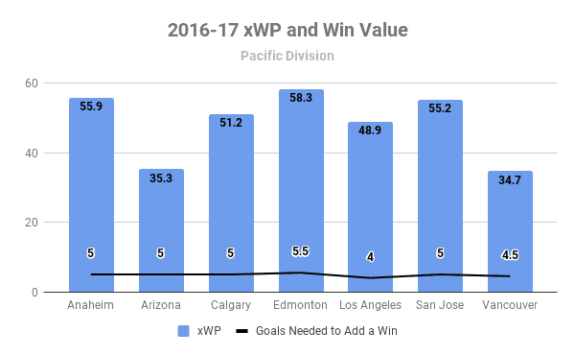
In applying these numbers to the 2016-17 NHL season results, the average win was worth 5.18 goals across the 30 franchises. The LA Kings had the lowest wV with four and the Washington Capitals had the highest with seven. Therefore, the Kings needed to score an additional four goals to gain a win while the Capitals needed seven. The results are based on the fact that Washington had the largest goal differential at plus-81 while Los Angeles had one of the smallest at minus-four.
Teams that scored 215 or fewer goals last season had a wV at or below five goals. There were 10 of those teams and only the Ottawa Senators made the playoffs. The teams that had the highest xWP also had the highest wVs. Those with an xWP of at least 50 had a wV of at least five goals, made up of 16 teams, and all but the Tampa Bay Lightning made the playoffs — the Bolts missed it by one point.
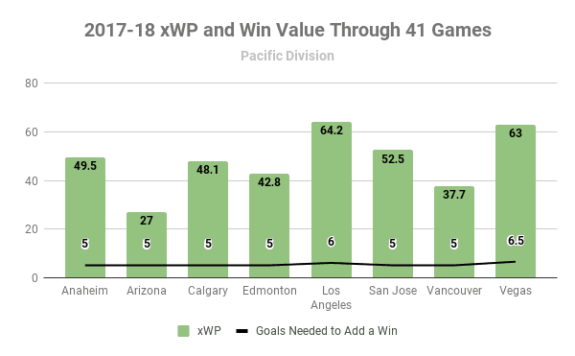
The charts that follow show a team’s xWP in the columns and their wV with the horizontal line. A general trend revealed that the higher a team’s xWP the higher their wV.
Atlantic Division

Metropolitan Division
Central Division
Pacific Division
2017-18 Season (41 Games)
Findings
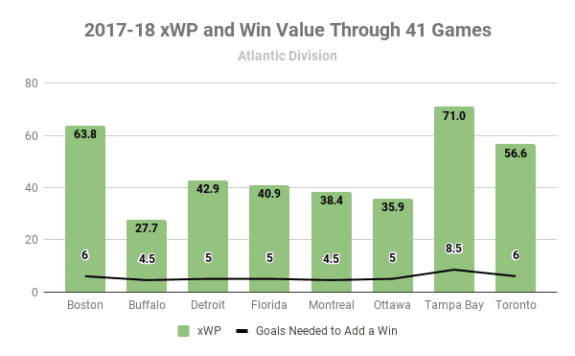
For the current season, I went with the 41 game goal totals similar to my previous article. Using 41 games means that I needed an increase of 2.4 percent to gain a win. In general, teams had higher wVs this season which could be an indicator of the increase in scoring. With more goals scored, the value of an individual goal decreases. At midseason, the league’s 31 teams had an average wV of 5.48 goals, a third of a goal higher than last season. There was a wV range between 4.5 (Montreal Canadiens and Buffalo Sabres) and 8.5 (Lightning) goals.
Teams that scored at least 130 goals had a wV of at least 5.5 goals. The Lightning, which had the highest wV, also led the league with 150 goals. Comparatively, teams with 115 or fewer goals all had wVs of either 4.5 or five goals. The best teams through 41 games, those with an xWP of at least 60, all had the highest wVs made up of five teams – Kings, Vegas Golden Knights, Winnipeg Jets, Bruins and Bolts. All but the Kings were in the top-10 in scoring.
Atlantic Division
Metropolitan Division

Central Division

Pacific Division
Using the Findings
Knowing the wV of each team can make predicting a player’s impact on a team easier and more accurate. One way I want to apply the information is at the upcoming trade deadline. With many teams seeking offensive improvement at the deadline, projecting a player’s production post-deadline can help measure how many additional wins he can bring to his new team.
For example, Evander Kane is likely the most prolific scorer available at the deadline this year, averaging .33 goals per game this season. Projected over a full season, he is on pace to score 27 goals, 11 more than he has now. If is traded to a team like Washington, which had a wV of 5.5 at midseason, he could add an additional two wins. Of course, this isn’t cut and dry. The Capitals could allow a goal post-deadline and other players could score goals for them in this scenario. However, it is a fun way to look at a player’s potential impact on a new team.

Another way to apply these findings is during the summer after the initial free agent frenzy has died down. I believe there is a path to projecting a team’s xWP and wV before the season starts. By averaging players’ goals over recent seasons and adding them together, we can roughly estimate a team’s goal totals. I will also have to consider a team’s goaltending and factor in rookies but it is an exercise I believe can be helpful.
I plan on running the formula at the end of the regular season to see how team trends changed from 41 to 82 games. I am also planning to work through previous seasons to see how accurate the model is with different scoring rates.
*All goal statistics came from Hockey-Reference
Free Newsletter
Get Advanced Stats coverage delivered to your inbox
In-depth analysis, breaking news, and insider takes - free.
Subscribe Free →