It is early in the NHL season, and the biggest change most fans will notice is in the overtime. Instead of 4-on-4 hockey, overtime will be played with three skaters to a side. The league expects a large portion of games will be decided during 3-on-3, making shootouts a less critical part of the NHL game.
Based on anecdotal evidence, this move appears to be popular with coaches and most players, though some goalies might be forgiven if they were less than enthused.
Any rule change of this nature is likely to have teams that benefit and teams that do not. Since there is little data on 3-on-3 overtime, it is difficult to make a case for determining which teams are better off and which are not. The closest we can come is to look at the results of 4-on-4 overtime from the prior year and suggest that a team good in that aspect of the game is probably going to be good in 3-on-3. A team that is not good in 4-on-4 probably won’t suddenly become good in 3-on-3. Still, this extrapolation has its limits. Muddying things up a bit more, teams are different each year. The confidence level in this extrapolation may be modest, but I would expect a reasonably positive correlation, perhaps with a few noteworthy misses.
There is a second part to the equation: how teams do in shootouts? In the case of a shootout, it really comes down to an individual, the goalie. Unlike the overtime play, it is straightforward to determine how good a goalie has been in shootouts. Further, this is not team dependent, it really is goalie dependent.
The Analysis
For this analysis, I looked at the 2014-15 season record for each team in their overtime games. Each team has a win percentage. If the theory holds, teams that have good winning percentages in overtime will enjoy having a greater portion of games settled in the overtime period. The flip side is also true, teams that struggle in overtime would probably prefer to have a shootout. The team that won 86 percent of its games in overtime last season probably never wants to see a shootout. The team that won only won 13 percent of its overtime games last season should want to skip overtime and go straight to a shootout. Alas, the league won’t allow that, but strategies can be developed to make that more likely.
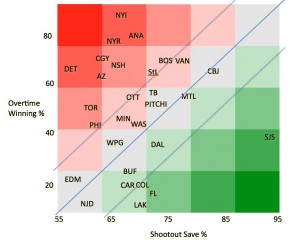
Below is a graphic designed to show where teams fit. The x-axis is the primary goalie’s save percentage on shootout attempts over the last two years. I have identified the goalies by their current team, even if they played elsewhere last season. For example, Cam Talbot’s save percentage is used for Edmonton, the team he now plays for. On the y-axis is the team’s winning percentage in 4-on-4 overtime from last season. Teams in the darkest red portions (upper left) are teams that should want the game to end in overtime. These are teams good in overtime, but not so good in shootouts. Conversely, teams in the lower right corner (darker green) are teams that have good goalies for shootouts, but have not been as successful in 4-on-4 overtime. The gray area represents teams that are equally good (or bad) in the two areas. Edmonton and New Jersey are poor in both areas, both goalies have a poor shootout save percentage and their team lost most of their overtime games. Columbus, though not as extreme in the other direction, is good in both areas.

I’d suggest that any team between the dotted lines on the graphic is close to equal in both aspects, meaning they should not really care how the game is decided. 16 of 30 teams fit this criteria, a few others are barely outside the dotted lines. Only 11 teams are significantly outside the dotted lines. Interestingly, eight of the 11 are in the section that prefers overtime, only three are in the section that prefers the shootout.
Those three are Los Angeles, Florida and San Jose. Notably, San Jose is the only team in the top ten in save percentage and bottom ten in overtime win percentage. Meanwhile, eight teams would prefer games get settled in overtime, and they look to be the biggest beneficiaries of the rule change.
Quantifying the Results
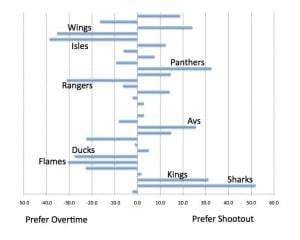
While the above chart gives a visual sense of who benefits and who doesn’t, it can be refined. These values can be quantified into a single number for each team. A bit of work to normalize the data and a little help from Pythagoras allows the calculation of a figure of merit (for the mathematically inclined folks reading this, the units are essentially arbitrary). This method should be more precise than the earlier graphic and the results are likely to shift, at least a bit. Below is the chart that captures these values. The larger the number, the more the team would prefer the shootout. Teams close to zero should not care. Five teams were significantly negative (<-25), meaning they should highly prefer to settle things in overtime. Four teams are significantly positive (>+25), meaning they are likely to be better off settling the game in a shootout.

The New York Islanders are the team most likely to benefit from the 3-on-3 overtime. In games decided during 4-on-4 overtime, they led the NHL in winning percentage last year. However, their top goalie, Jaroslav Halak, ranked only 20th out of the 30 goalies in shootout save percentage. The Detroit Red Wings, when shootout-challenged goalie Jimmy Howard is in net, is another team that should benefit from the new overtime.
Only one team was decidedly better in the shootout and decidedly poorer in overtime, the San Jose Sharks. Not surprisingly, their figure of merit has the greatest absolute value, over +50. This suggests they are the team most likely to be negatively affected by 3-on-3 overtime. For the Sharks, getting to a shootout instead of settling the game during the overtime would be smart.
The Florida Panthers are another team that might wish to slow things down in overtime to get to the shootout. They have been among the worst overtime teams, winning just 17 precent of their overtime games last season. Put the game in the capable glove of Roberto Luongo, a slightly above average shootout goalie over the last two seasons. It gives the Panthers slightly better than a 50 percent chance to win the game, a major improvement from 17 percent. If the Panthers have 20 games that go past regulation (NHL average was 21 last year) and they could get all 20 games to the shootout, they could expect 11 additional points from the extra sessions. However, if only 30 percent of their overtime games go to the shootout (30 percent is about what the league anticipates) and the Panther’s overtime win percentage stays similar, they would only expect to earn five additional points. A six point difference (11 in one case, just 5 in the other) in the standings is meaningful to a team that appears to be a fringe playoff contender.
We are only handful of games into the season for each team, and with the four teams (NYI, DET, FLA, SJS) that are at the extremes, we’ve only seen two games go past regulation. The Isles, who had a strong overtime record last year, lost in the overtime session to Chicago, albeit the winning goal was not scored during 3-on-3 play. Chicago was on a 4-on-3 power play when they tallied this game winner. The Sharks, who should prefer the shootout, made it past the overtime session (with Sharks goalie Martin Jones turning back a clean breakaway during 3-on-3 play) and won their shootout against New Jersey. It is too early to see any trends, but not too early for teams to consider their strategy options for the overtime session.
In an earlier article on the Sharks and their options in overtime, I described using a stalling tactic to get to the shootout. As the season evolves, there will be greater clarity on what 3-on-3 overtime means to each team. Teams should consider whether the free-wheeling approach that 3-on-3 play encourages is really in their own best interest.