A recent study of Major League Baseball (MLB) looked into how player performance is affected by travel. To no one’s surprise, they found issues.
What made this study unusual is not the conclusion. It is the sheer volume of data and the rigorous mathematical approach. Anecdotal beliefs have been statistically confirmed. The study looked at 40,000 games and found statistically significant changes in high-impact areas like home runs hit (by position players) and home runs allowed (by pitchers).

One important conclusion was that ‘travel direction’ matters. Trips going from west to east had a greater impact than trips headed from east to west. The authors were able to say traveling itself was not inherently impactful, but changing times zones was. Traveling without changing time zones was not shown to have a strong impact on player performance.
Few of the authors’ conclusions are likely to surprise people. They fall in line with conventional wisdom.
A Comparison to Hockey
Is this analysis applicable to hockey? Almost certainly. The travel challenges for some hockey teams are likely more challenging than for baseball teams. Baseball teams play 162 games while hockey teams play only 82. However, baseball teams play series, typically 3 games, at a given road ballpark. Hockey teams almost never play multiple consecutive games in the same road venue.
I’ve compared two travel schedules: one for the upcoming 2017 season for the San Francisco Giants baseball team, and the other for the 2016-17 San Jose Sharks season. These are two teams are from the same geographic location, residing only about 45 miles from each other.
Results
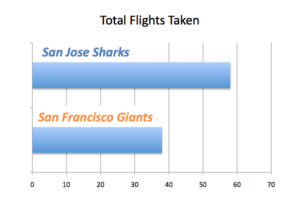
Though NHL teams play about half as many games as MLB teams, the amount of travel by two teams from the same geographic area is mostly similar. There is one exception: the number of plane flights. In this area, the hockey team takes 53% more flights. The Sharks take 58 flights during the regular season, the Giants just 38.
While the authors judged the number of flights as not impactful, the upper travel limits in the baseball study were likely a good bit lower than the Sharks’ travel figure.
For the baseball Giants, they will take a flight prior to 38 out of the 162 total games. The result is 23% of their games come after a flight. For the Sharks, the corresponding figure is 71% (58 out of 82). It is unlikely the baseball study accurately accounts for this large of a difference in travel. The conclusion in the baseball study that the number of flights did not have much impact might not port over to the hockey case.
In terms of trips with time changes and time changes of two hours or more, the Sharks and Giants are almost identical. The Giants have 14 trips with multiple-hour time changes, with seven in each direction. The Sharks have 12 such trips, with six in each direction.
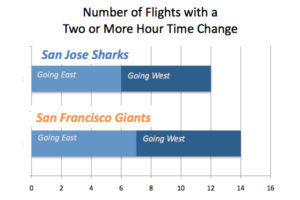
The Giants have 24 trips with a time change, the Sharks 26. The travel breakdown is interesting. The Sharks change time zones more going east to west (15) than west to east (11 times). The study suggests this is the more favorable approach, that starting trips in the eastern time zone and migrating west over the course of a road trip is the better scenario for a western team on a road trip.

Considerations
There are some important differences between NHL and MLB play. In MLB, the most important player, the starting pitcher, has several days off between games. For starting pitchers, travel does not combine with playing on limited rest. Rest and travel would seem to go hand-in-hand, but starting pitchers get full rest, even when they travel.
Another consideration that is absent in the baseball analysis is border crossings. In baseball, border crossings are rare. Toronto is the only team located outside of the United States. However, in the NHL, seven of the 30 teams are in Canada, meaning a substantial portion of NHL travel involves an international border crossing.

The observable effects associated with baseball travel are likely to be similar with, if not greater than, hockey. The baseball study is perhaps the best proxy for hockey. Baseball has a deep statistical history with greater clarity in its statistics. For example, a hitter’s results over a number of games are largely based on his own performance. In hockey, a player’s results are greatly affected by a larger number of factors. Hockey statistics tend to be laced with subtlety, making it more challenging to perform a similar type of study.
Unsurprising Conclusions
The study results are consistent with what most people already believe. Travel has an impact and certain types of travel are more impactful than others.
The authors suggest specific actions to mitigate the effects of travel. Sending starting pitchers to their destination a day or two ahead of the rest of the team is one such suggestion.
For the San Jose Sharks, the coach noticed a very poor record in the first home game after the team returns from the road. So the coach changed the travel schedule. Instead of leaving after a road game for a long flight home, the team often stays an extra night locally and travels the next day. It seems to have helped.
Much of the information about the impact of travel on player and team performance is anecdotal or empirical. This sort of information can help teams identify “best travel practices.”
The baseball study further justifies the efforts coaches and management make to develop smarter travel strategies for their teams. In hockey, where the effects are likely greater than baseball, smarter travel strategies are a meaningful advantage.
Free Newsletter
Get Commentary coverage delivered to your inbox
In-depth analysis, breaking news, and insider takes - free.
Subscribe Free →