Every start of the NHL season, some teams look much better or worse than they really are. Luckily, we can use advanced metrics to help us figure out which teams are underperforming or unlucky and which ones are the opposite. This gives us a great early-season “lie detector” test. Using data from Natural Stat Trick (as of Nov. 24 morning), we created a table to filter out these teams.
We mainly focused on a few stats like raw Corsi For percentage (CF%) and expected Goals For percentage (xGF%), regressed them, and came up with an offensive rating (35/65 split since we weigh xGF% more). Adding in the actual goal differential, we get a clearer picture of which teams are red-hot and likely to cool off and vice versa.
The 2025-26 “Offensive Talent Rating” Rankings
The overall (all situations) “Offensive Talent Rating” was calculated with this formula:
- All-Situations Offensive Talent Rating (OTR) = 0.35 x Regressed CF% +0.65 x Regressed xGF%
- Regressed CF% (rCF%) = (CF +1200) / (CF + CA +2400)
- Regressed xGF% (rxGF%) = (xGF +12.0) / (xGF + xGA +24.0)
Related: The Maple Leafs are Too Slow in a Fast NHL
Regression was calculated, estimating 30 games of league-average events. And the Corsi regression numbers are a consensus from other quantifying sites like Natural Stat Trick and Evolving-Hockey (~1,100-1,250), similar to the XG regression added (11.0-13.0 for Evolving-Hockey).
Here is where all 32 teams rank in terms of OTR. The higher the OTR, the more proficient a team is at offense, hypothetically:
| Rank | Team | CF% | xGF% | rCF% | rxGF% | OTR | Actual GF% | Diff | Point % |
|---|---|---|---|---|---|---|---|---|---|
| 1 | CAR | 59.69 | 55.30 | 57.26 | 54.26 | 55.83 | 54.61 | +1.22 | .682 |
| 2 | COL | 54.75 | 59.01 | 54.08 | 56.12 | 55.42 | 64.71 | -9.29 | .841 |
| 3 | WSH | 53.46 | 54.11 | 53.18 | 53.24 | 53.23 | 54.20 | -0.97 | .545 |
| 4 | LAK | 53.84 | 52.48 | 53.49 | 52.11 | 52.54 | 50.00 | +2.54 | .591 |
| 5 | FLA | 53.77 | 51.97 | 53.38 | 51.76 | 52.35 | 48.80 | +3.55 | .548 |
| 6 | TBL | 50.37 | 54.57 | 51.10 | 53.48 | 52.47 | 52.38 | +0.09 | .619 |
| 7 | VGK | 50.94 | 53.88 | 51.48 | 53.06 | 52.41 | 53.17 | -0.76 | .643 |
| 8 | UTA | 52.60 | 51.84 | 52.60 | 51.76 | 52.22 | 49.62 | +2.60 | .568 |
| 9 | DET | 51.81 | 53.06 | 52.02 | 52.47 | 52.29 | 47.76 | +4.53 | .614 |
| 10 | OTT | 51.94 | 50.61 | 52.11 | 50.88 | 51.28 | 49.64 | +1.64 | .619 |
| 11 | NJD | 50.73 | 50.58 | 51.34 | 50.88 | 51.06 | 49.61 | +1.05 | .643 |
| 12 | CGY | 51.99 | 49.73 | 52.14 | 50.26 | 50.94 | 44.53 | +6.41 | .396 |
| 13 | NSH | 52.90 | 48.77 | 52.74 | 49.62 | 50.67 | 39.67 | +11.00 | .381 |
| 14 | ANH | 51.36 | 49.18 | 51.74 | 49.85 | 50.54 | 53.38 | -2.84 | .659 |
| 15 | DAL | 46.10 | 51.71 | 47.90 | 51.49 | 50.18 | 53.85 | -3.67 | .682 |
| 16 | STL | 48.52 | 50.48 | 49.62 | 50.68 | 50.27 | 42.45 | +7.82 | .455 |
| 17 | PIT | 47.87 | 52.48 | 49.26 | 51.98 | 50.99 | 53.78 | -2.79 | .595 |
| 18 | EDM | 50.40 | 48.92 | 51.06 | 49.62 | 50.12 | 46.54 | +3.58 | .521 |
| 19 | NYR | 50.27 | 49.20 | 50.98 | 49.74 | 50.16 | 48.31 | +1.85 | .478 |
| 20 | CBJ | 50.32 | 48.78 | 50.99 | 49.44 | 50.02 | 48.15 | +1.87 | .568 |
| 21 | NYI | 49.85 | 48.67 | 50.52 | 49.23 | 49.65 | 52.24 | -2.59 | .609 |
| 22 | PHI | 48.28 | 49.88 | 49.45 | 50.12 | 49.91 | 50.00 | -0.09 | .625 |
| 23 | MTL | 48.31 | 48.61 | 49.48 | 49.23 | 49.28 | 49.32 | -0.04 | .595 |
| 24 | MIN | 48.53 | 49.15 | 49.70 | 49.47 | 49.58 | 50.77 | -1.19 | .609 |
| 25 | BUF | 46.77 | 47.17 | 48.35 | 47.78 | 47.95 | 48.28 | -0.33 | .500 |
| 26 | TOR | 46.38 | 47.45 | 48.14 | 48.26 | 48.20 | 47.44 | +0.76 | .477 |
| 27 | VAN | 47.32 | 46.36 | 48.49 | 47.03 | 47.47 | 44.52 | +2.95 | .435 |
| 28 | WPG | 46.88 | 47.63 | 48.48 | 48.44 | 48.46 | 52.80 | -4.34 | .571 |
| 29 | BOS | 48.07 | 45.24 | 49.34 | 46.88 | 47.68 | 49.01 | -1.33 | .542 |
| 30 | SEA | 46.07 | 48.07 | 47.87 | 48.29 | 48.14 | 50.44 | -2.30 | .636 |
| 31 | CHI | 45.50 | 43.07 | 47.38 | 45.40 | 46.11 | 53.08 | -6.97 | .545 |
| 32 | SJS | 43.62 | 43.45 | 46.08 | 45.62 | 45.81 | 48.55 | -2.74 | .543 |
A quick look at the table shows some obvious and not-so-obvious teams in the rankings. The Carolina Hurricanes and Colorado Avalanche are at the top, to no one’s surprise. They’re likely the two favorites to win the Stanley Cup. And on the flip side, the San Jose Sharks and Chicago Blackhawks are at the bottom. While filled with promising young talent, they’re still in the thick of a rebuild.
However, if we look at the actual goals and point percentages, this is where things get quirky.

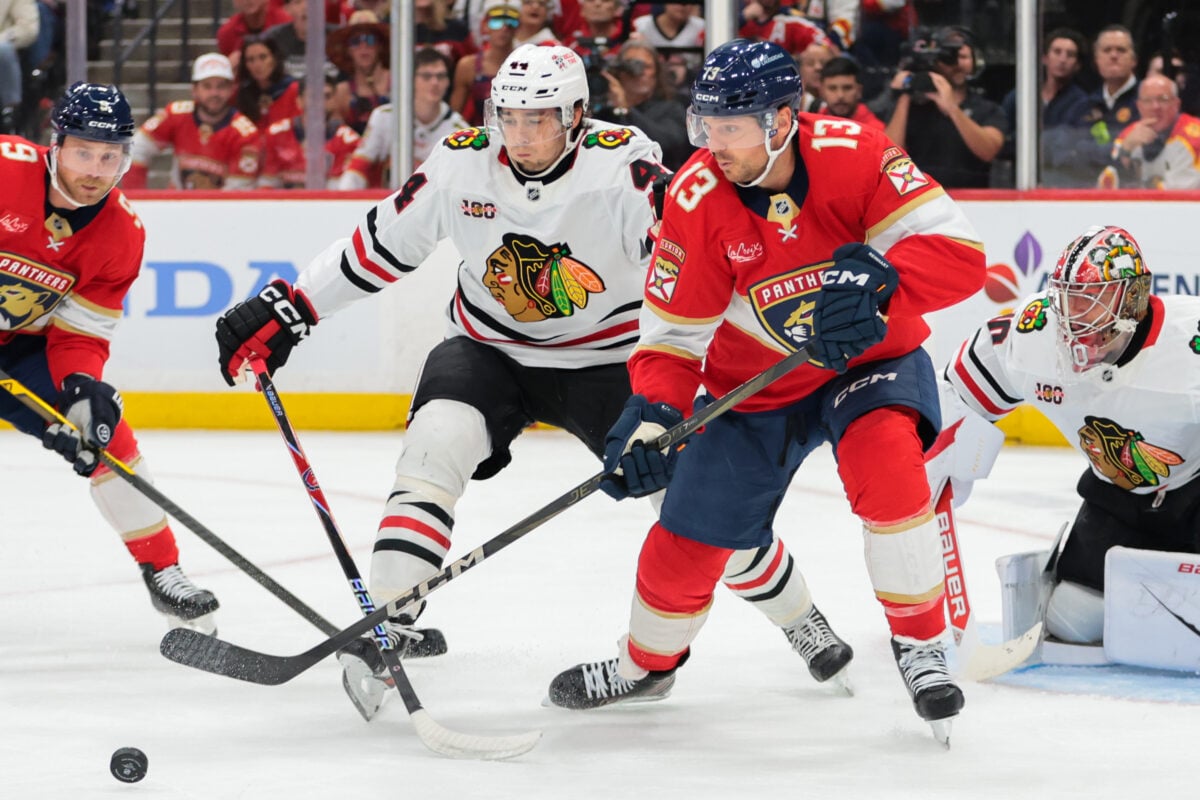
Chicago and San Jose, despite being last in the rankings, are above .500 in point percentages. They’ve also been more effective at scoring despite their low OTRs. On the other side, the Florida Panthers have a point percentage similar to Chicago and San Jose despite being in the top five in OTR. They are not scoring as well as their metrics suggest and are thus not winning as much.
Looking at the “Difference” column, we can make an educated guess as to which teams may be due to regress positively or negatively moving forward.
Teams That Could Heat Up (Regress Positively)
Nashville Predators
The Predators’ plus-11 difference in OTR and actual goals is striking. They’re at the bottom of the NHL with a 6-11-4 record because they’ve been both unlucky (.957 PDO) and inept at scoring or preventing scoring. They’re old, slow, and have roster issues that will take time to fix. But we should expect the Predators to start getting better bounces, pick up their scoring, and win more games, even if this season appears all but lost.
St. Louis Blues
Here is another Central Division team that could go on a run. But unlike the Predators, we haven’t stuck a fork in the Blues just yet. It starts in goal for the Blues, where Jordan Binnington could “turn it on” at any time and go on a run (maybe closer to the 2026 Olympics?). He’s already a lock to be on Team Canada and can steal games. The Blues will also need to improve on their high-danger finishing rate (15%, fifth-worst).
Calgary Flames
At their current pace, the Flames could be frontrunners to get consensus first-overall 2026 pick Gavin McKenna. But it’s the Flames. This franchise has an uncanny ability to go the other way of expectations. We expect them to start moving players closer to the NHL Trade Deadline. Their already-moribund scoring — dead-last in shooting percentage (SH%) at 8.06% — could get worse. But just from a numbers perspective, we expect them to boost it a bit. And as long as Dustin Wolf is in between the pipes, the Flames should nab a bit more points.
Teams That Could Cool Off (Regress Negatively)
Colorado Avalanche
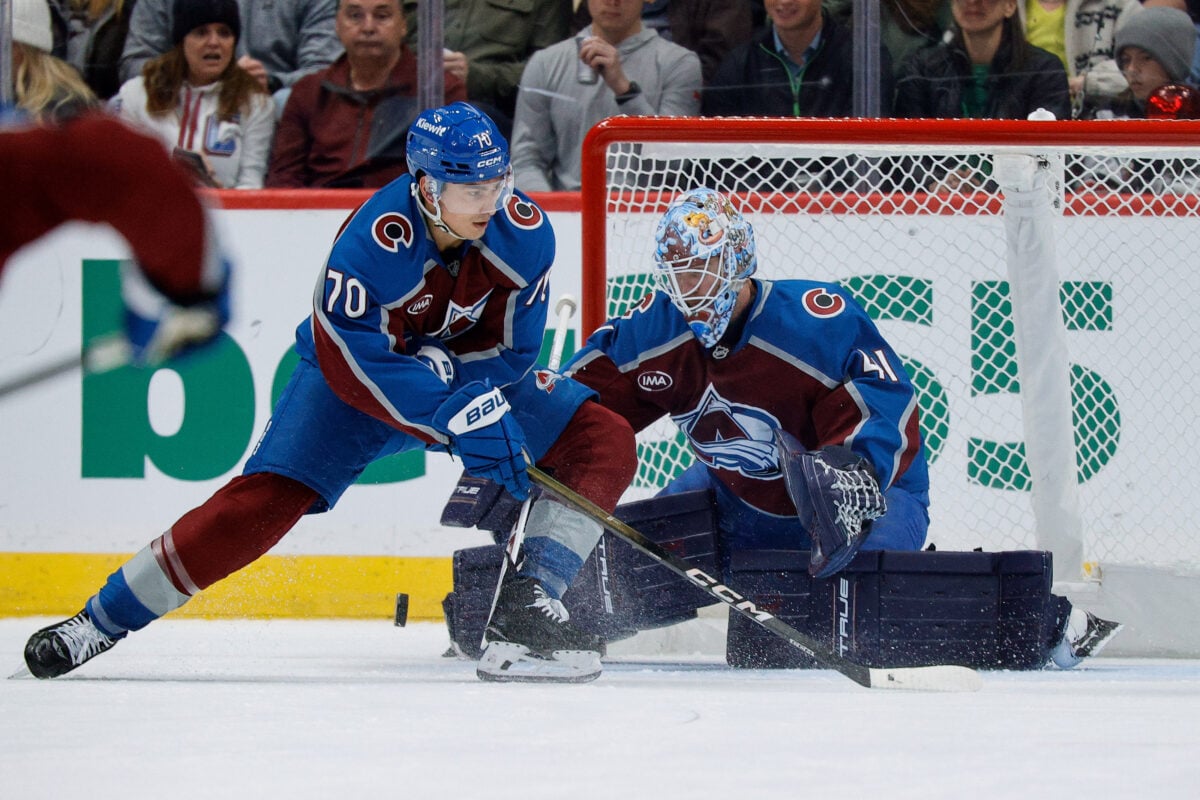
We’re not saying the Avalanche will go cold. But their high-danger goals ratio (64.6%) is unsustainable, and being negative-9.29 in OTR differential is telling (even by their prolific standards). Their SH% should maintain (12.07%), but their save percentage (91.6%) is due to regress. They are also on pace for 138 points, which would be an NHL record. While we’d love to see it, it’s likely too optimistic.

Chicago Blackhawks
The Blackhawks have a nice story going, and most of us would love to see it continue. But we’ve seen this before: a young team starts hot only to falter down the stretch. The numbers support this narrative as their negative-6.97 differential means they are overachieving. Connor Bedard has slowed down, even if he’s still adding NHL accolades. And it’s unlikely the team keeps netting 12.61% of their shots on net.
Winnipeg Jets
The Jets have a habit of overachieving nearly every season (see last season’s Presidents’ Trophy finish). But Connor Hellebuyck’s absence after surgery is just one omen that times are about to get brutal. They are already in the bottom quarter when it comes to possession and scoring metrics. And without their three-time Vezina Trophy-winning goalie to steal games, the Jets could quickly get outpaced in an ever-competitive division.
Final Thoughts
As the 2025-26 season nears the quarter pole, the gap between process and results has rarely been wider. The Predators, Blues, and Flames are playing better than their win-loss records indicate. They are three of the biggest positive-regression candidates, even if we’re not holding our breath on earth-shattering improvements.
On the flip side, the Avalanche’s blistering start, the Blackhawks’ surprising competitiveness, and the Jets’ annual goaltending-fueled mirage are all built on unsustainable finishing and goaltending luck that history says will evaporate.
In a league where luck eventually runs out, our regressed Offensive Talent Rating shows exactly which teams are living on borrowed time, and which ones could turn the tables.
