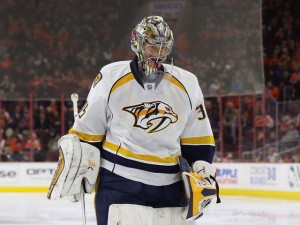
As the National Hockey League enters its 100th year (yes, I know, it is technically only the 99th season), it is truly astounding that, with a century of data to pore over, the hockey world still does not understand what is perhaps the most important position in the sport: the goaltender. Goalies are notoriously unpredictable, flaky, superstitious and just downright weird. It seems that their on-ice outcomes are no different.
Take Pekka Rinne, for example. Ask anyone who follows hockey and you will, no doubt, be told that he is among the top puck-stoppers in the league. A brief glance at his career highlights will support this; two All-Star Game selections (though last year’s might have been of the Mike Komisarek variety) and finalist for the Vezina Trophy on three occasions, not to mention saves like this:
However, look at his career numbers and a puzzling paradox emerges: It seems that Pekka Rinne is either an elite, dominating force whose save percentage hovers around .925, or a wildly inconsistent sieve that struggles to crack .900.
How is this possible? I, with the help of the wonders of Corsica, tried to find out.
Thoroughly Average?
Note: Five-on-three and three-on-five situations were excluded from my analysis, due to their rarity and corresponding small sample size.

Between 2008-09 – Rinne’s first full season – and 2015-16, the average five-on-five save percentage among goalies (with at least 20 full games worth of NHL playing time) is .919. Pekka Rinne has dipped below this benchmark only once, in his injury-plagued 2013-14 campaign in which he posted an .899. Hey, for eight NHL seasons, that’s pretty good!
At five-on-four, the average Save percentage is, surprisingly, slightly lower at .913. Perhaps this unexpected result is a function of more chances against on the power play being of high quality – breakaways and or odd-man rushes off of blocked shots or intercepted passes, that kind of thing. Whatever the case, Pekka Rinne has a career .917 save percentage while his team is on the power play; again, above-average. The plot thickens.
While his team is down a man, Rinne has a save percentage of .878 for his career, marginally below the league average of .881. Not brilliant, but, as with his power play save percentage, I’m not sure how significant this variation really is.
Consistently Inconsistent
His year-by-year splits aren’t any help, either. Take 2013-14 for example: A dreadful .899 save percentage at five-on-five is accompanied by a spectacular .895 rating on the penalty kill and a perfect 1.000 whilst the Preds had a manpower advantage. Meanwhile, the year previous, Rinne couldn’t stop a beach ball on special teams (.836 and .733[!!!], respectively) but was a .928 goalie at even strength.

All this behind a team that, since Rinne’s full-time debut, has been pretty average in most major categories. For example, they’ve been a middling possession team (Corsi For percentage is 49.6% versus a league average of about 50%). They also have an average shooting percentage (7.85% versus a league average of 7.82%).
Even breaking it down year-by-year, there is no relationship between the Predators’ possession proficiency and Rinne’s performance. Penalty differential, shots for, shots against… Nothing seems to explain the enormous variations in his performance from one season to the next. The only thing that might come close is that Rinne’s year-by-year overall save percentage is moderately correlated (0.62) with his team’s year-by-year shooting percentage. So Preds, you know, just be luckier. Not hard, right??
Rinne Roulette
So what did we learn? Well, trying to figure out goaltending – not to mention the goaltenders themselves – is a lot like trying to make a save without looking at the puck and while facing the wrong way. …oh wait:
Nashville has gotten off to a mediocre start this year, but I’m not too worried about it. The present-day Predators are a much different team from those which have graced Nashville throughout much of the team’s history. The past couple of seasons have seen Ryan Johansen, Filip Forsberg and James Neal arrive to provide the traditionally goal-starved Preds with elite offensive prowess. The defense core is – as ever – probably the best in the league. And their starting goaltender seems to be back on his world-beating form, at least so far.
Pekka Rinne’s career save percentage (all situations) is .917. That’s solid, decent, acceptable, average. What pains those that watch him is the fact that he can be so very, very much better – and is often so very, very much worse. Each year, it is a bonafide coin flip regarding which Pekka Rinne shows up as the starting goalie for the Nashville Predators.
This season, it appears that the ball has fallen the Preds’ way in this round of Rinne Roulette. No one knows how or why, but he’s back. His resurgence could not have come at a better time as, despite a rough start, Nashville’s top-flight skaters are rounding into form, as well. Forget the Rooster; 2017 might well be the Year of the Predator.